Financials Demo
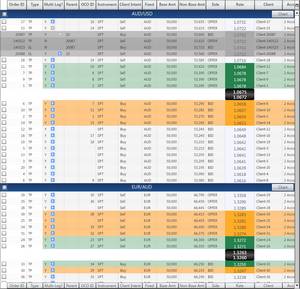
This demo is a financial application displaying a set of FX orders, colors coding each order based on how far away it is from being executed.
The model for these orders is a hierarchical model with a top-level list of Currency Pairs, each with a list of orders in that currency. Each order has, in turn, a number of dependent orders that will become active when an order is executed.
The position of the Buy/Sell price and color coding of each order is updated every time the rate for the currency pair changes. As all orders are sorted within the model, the grid disables column sorting.
In additional to the main tab where the application is rendered in a KineticGrid, there is are two additional tabs where a basic implementation of the same functionality is provided using an MX grid and a Spark (Flex 4.5.1) grid, using identical data models. There has been no optimization carried out on the MX and Spark grids but, in turn, there are no complex renderers used that would impair its performance.
The downloadable AIR demo also provides two additional tabs showing multigrid performance for both KineticGrid and MX Grid. The models used for these grids is identical to those in the single grid tabs, but each grid is only provided with the data model for a single currency pair. The use of 6 grids on each tab consumes a bit more memory which is why I didn't add these to the online Flex demo.
About The Demo Application
There are several helpful panels on the left of the application to help you evaluate the performance of the grids:
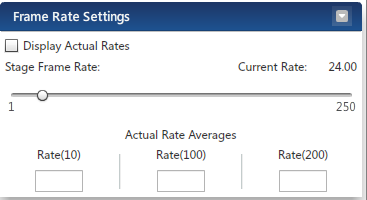
This panel will allow you to display and change the current frame rate of the application, both the defined rate (displayed as Current Rate) and the actual rate, averaged over 10, 100 and 200 frames.
The Flash player will attempt to render frames at the requested frame rate - should the average frame rate drop below the defined rate, the Flash player is running at 100%.
The average frame rate will only be displayed if the 'Display Actual Rates' checkbox is selected.
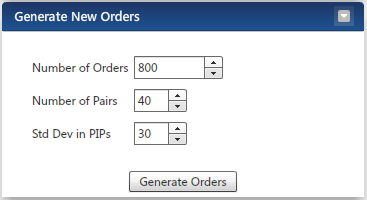
This panel lets you generate different sets of orders, changing the quantity of orders, the number of Currency Pairs the orders are for, and the Standard Deviation of the orders from the default application market price.
The orders are randomly generated but normally distributed around the defined market price. The greater the Standard Deviation, the greater the price rage for the order. Each generated order will automatically have nested orders.
Currently only 40 pairs are defined in the application. Up to 20,000 orders can be generated, distributed equally across all specified pairs. Each Grid has an independent data set but the orders values for both grids will always be identical. Orders for a grid are only generated when the grid becomes active.
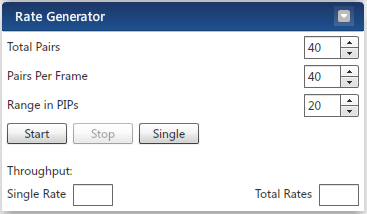
This panel allows you to pump rates into the model on a discrete or continuous basis. The Buy/Sell price for each currency pair starts off at the application-defined start price, then increments by a single pip each frame, until the maximum range is met. The price will then decrease until the minimum value is met.
As mentioned there are 40 currency pairs in the application. You can choose to generate rates for only a subset of pairs (always starting at AUD/USD), or for all pairs but only a subset or rates per frame.
The throughput box show the number of AUD/USD rates pumped in the last second, and the Total Rates shows the total number of rates processed by the model in the last second.
Normally, the Single Rate value is equal to the average frame rate of the application, but the Rate Generator has been configured so that it will skip a frame if rendering on the frame is still outstanding. Without this, the the screen could freeze.
When pumping rates into the model, you will see the rate indicators move up and down the grid, and orders changing color based on how close they are to triggering (obviously, in this demo, no order triggering is implemented).
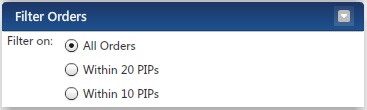
By placing a filter on the orders based on their distance from market, orders will be added and removed from the order model every time the rate changes, as their distance from the markets exceeds or enter the filter range.
The number of orders added and removed will depend on the quantity and distribution of the orders, as mentioned above. Note: each order is added/removed individually, so there will be a lot of model changes when the order quantity is high.
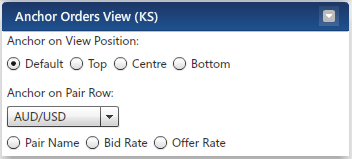
When orders are changing position in the data model, the screen can jump around as the row at the top of the grid is moved. This panels lets you select the on-screen row that should be anchored when rates change.
In this demo, you can anchor a row at either the top, middle or bottom of the screen (but if these move off-screen the Grid will pick a new row to anchor on), or on a fixed element on the view associated with a currency pair i.e. the Pair Row, the Buy or the Sell price row.
Only one of the seven options can be selected. If a pair row is selected but is not visible, then the grid will anchor on the middle row.
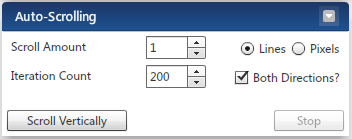
Scrolling a Data Grid can be particularly damaging to performance in Flex. This panel lets you scroll the selected grid automatically, making a single scroll change every frame.
By default, it will scroll down a single line 200 times, then back up, but you can change both the number or lines scrolled each frame, the total number of scroll operations to carry out, and whether you want to it be bi-directional.
Increasing the number of lines per frame will show you the performance impact when scrolling large data sets, keeping it low will show you the performance for small data sets.
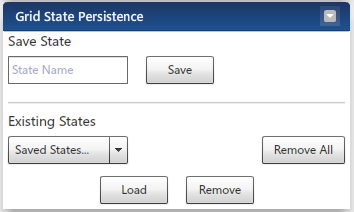
This panel enables you to save and restore the state of the KineticGrid to a named state. Among the aspects to be saved are the column positions, visibility, and widths. At any point, a saved state can be loaded which will apply the state immediately to the grid.